As shown below, I created my product database, starting by setting up a unique product number followed by the product's name. Moreover, after evaluating the competitor prices and the unit cost, I set up the product's price.
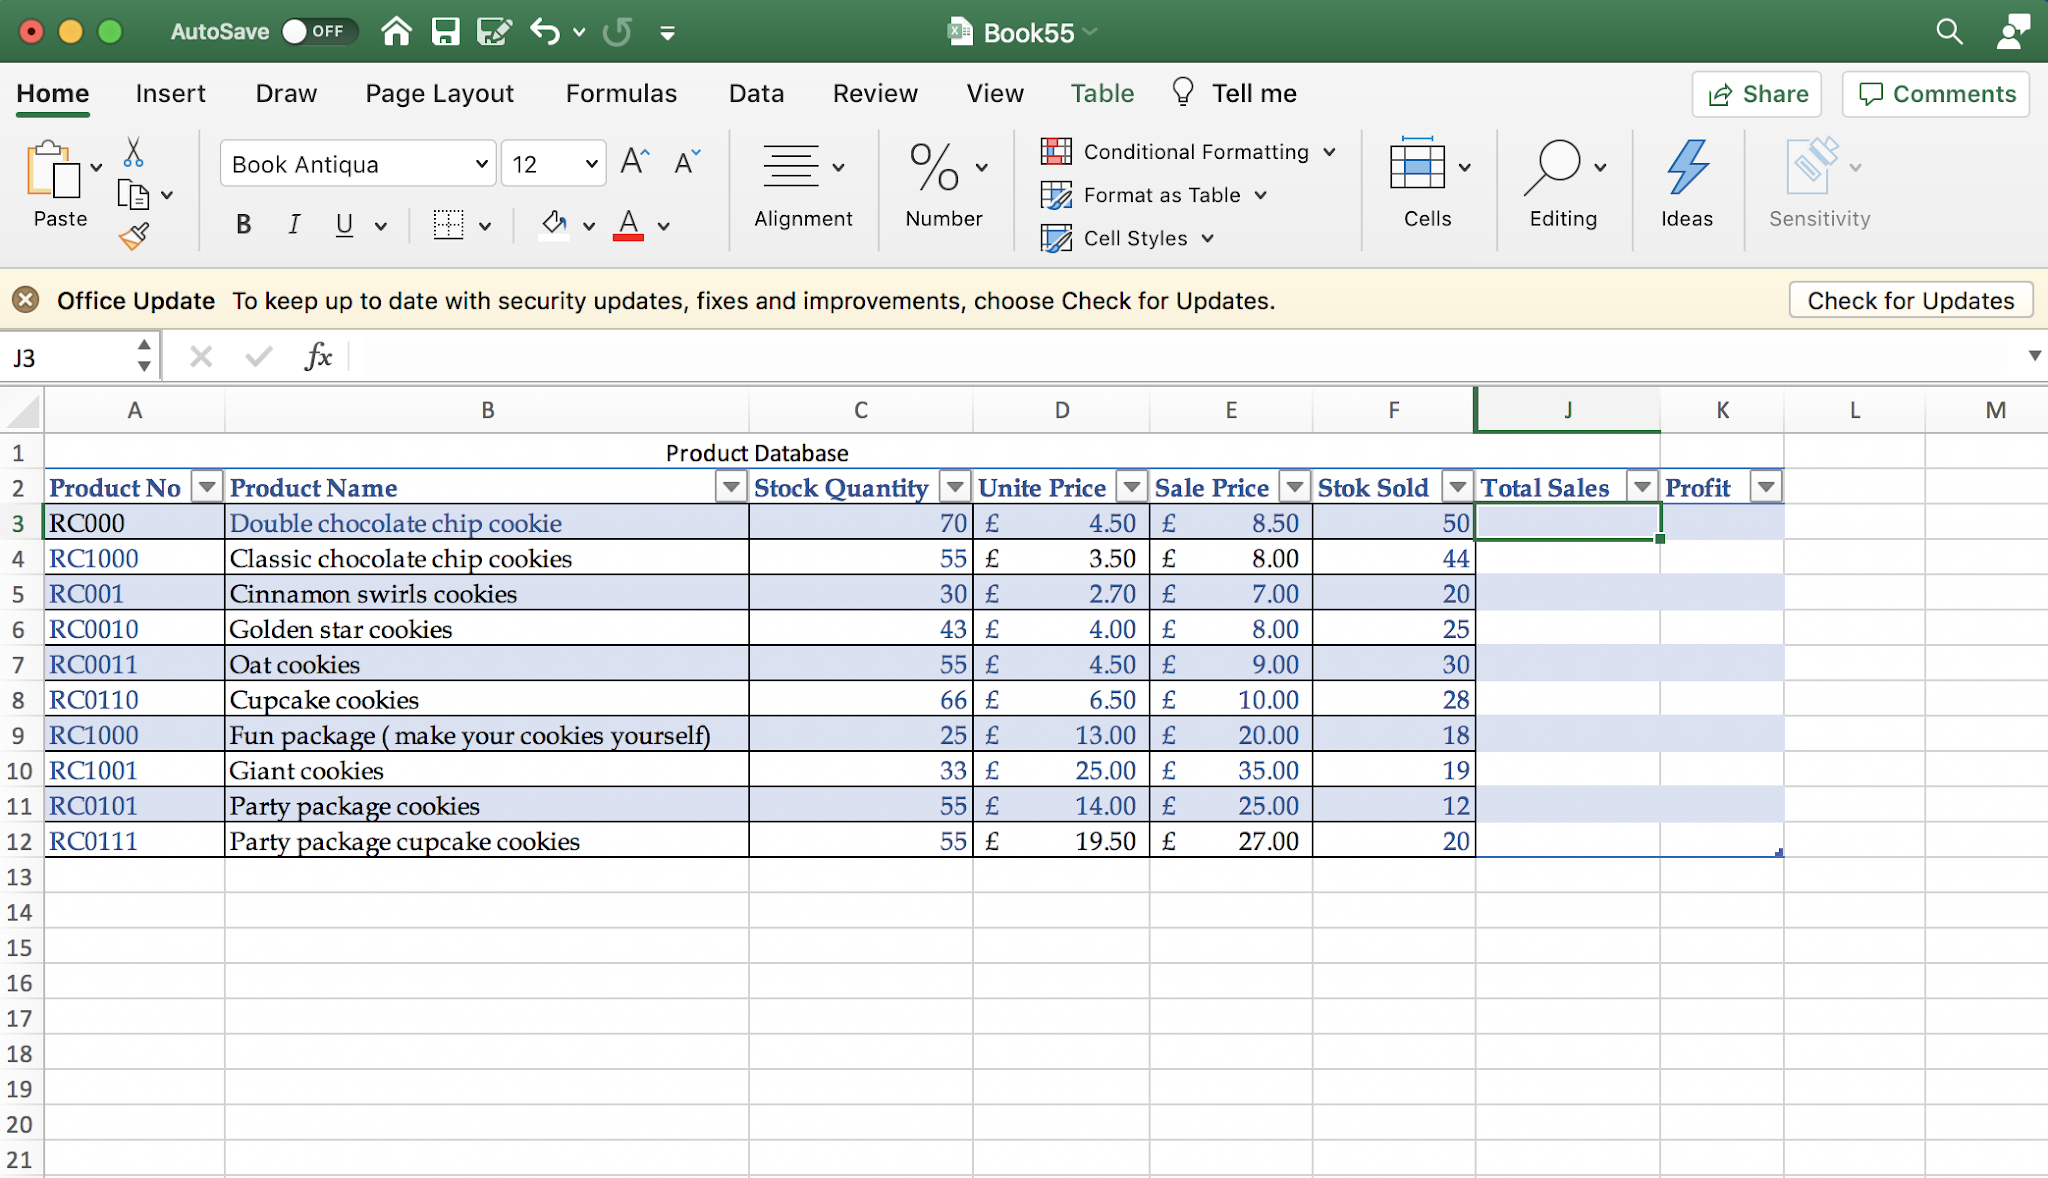 |
| The initial table |
One of the fundamental elements to be listed on the database is the Total sales, and it could be calculated easily by inserting the sign (=) on the cell following by the cells (sale price) times (Stok sale).
 |
| Total Sales equation |
Excel will calculate the total sales. Instead of doing the same for every product, all I had done is to click Enter, and the total sales equation was inserted to all of the other products.
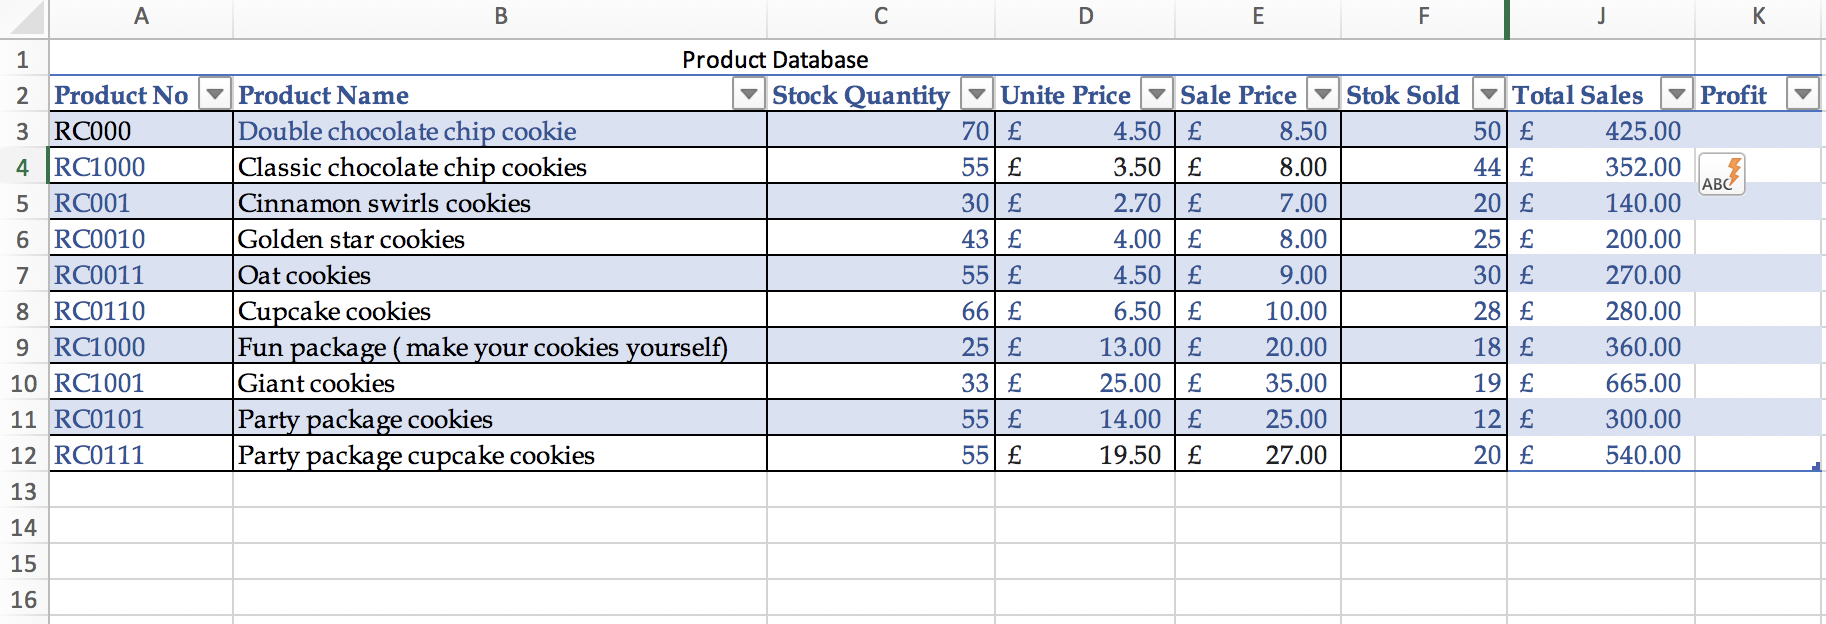 |
| Total Sales results |
Knowing the cost will help later to calculate the profit. Therefore, I added a column for cost on the database. Calculating the cost is pretty simple; first, insert the sign (=) followed by the cells stock quantity times unit price. The cells could be chosen by clicking on them, as shown below. Similar to finding the total sales, I clicked Enter to apply the equation to all other products.
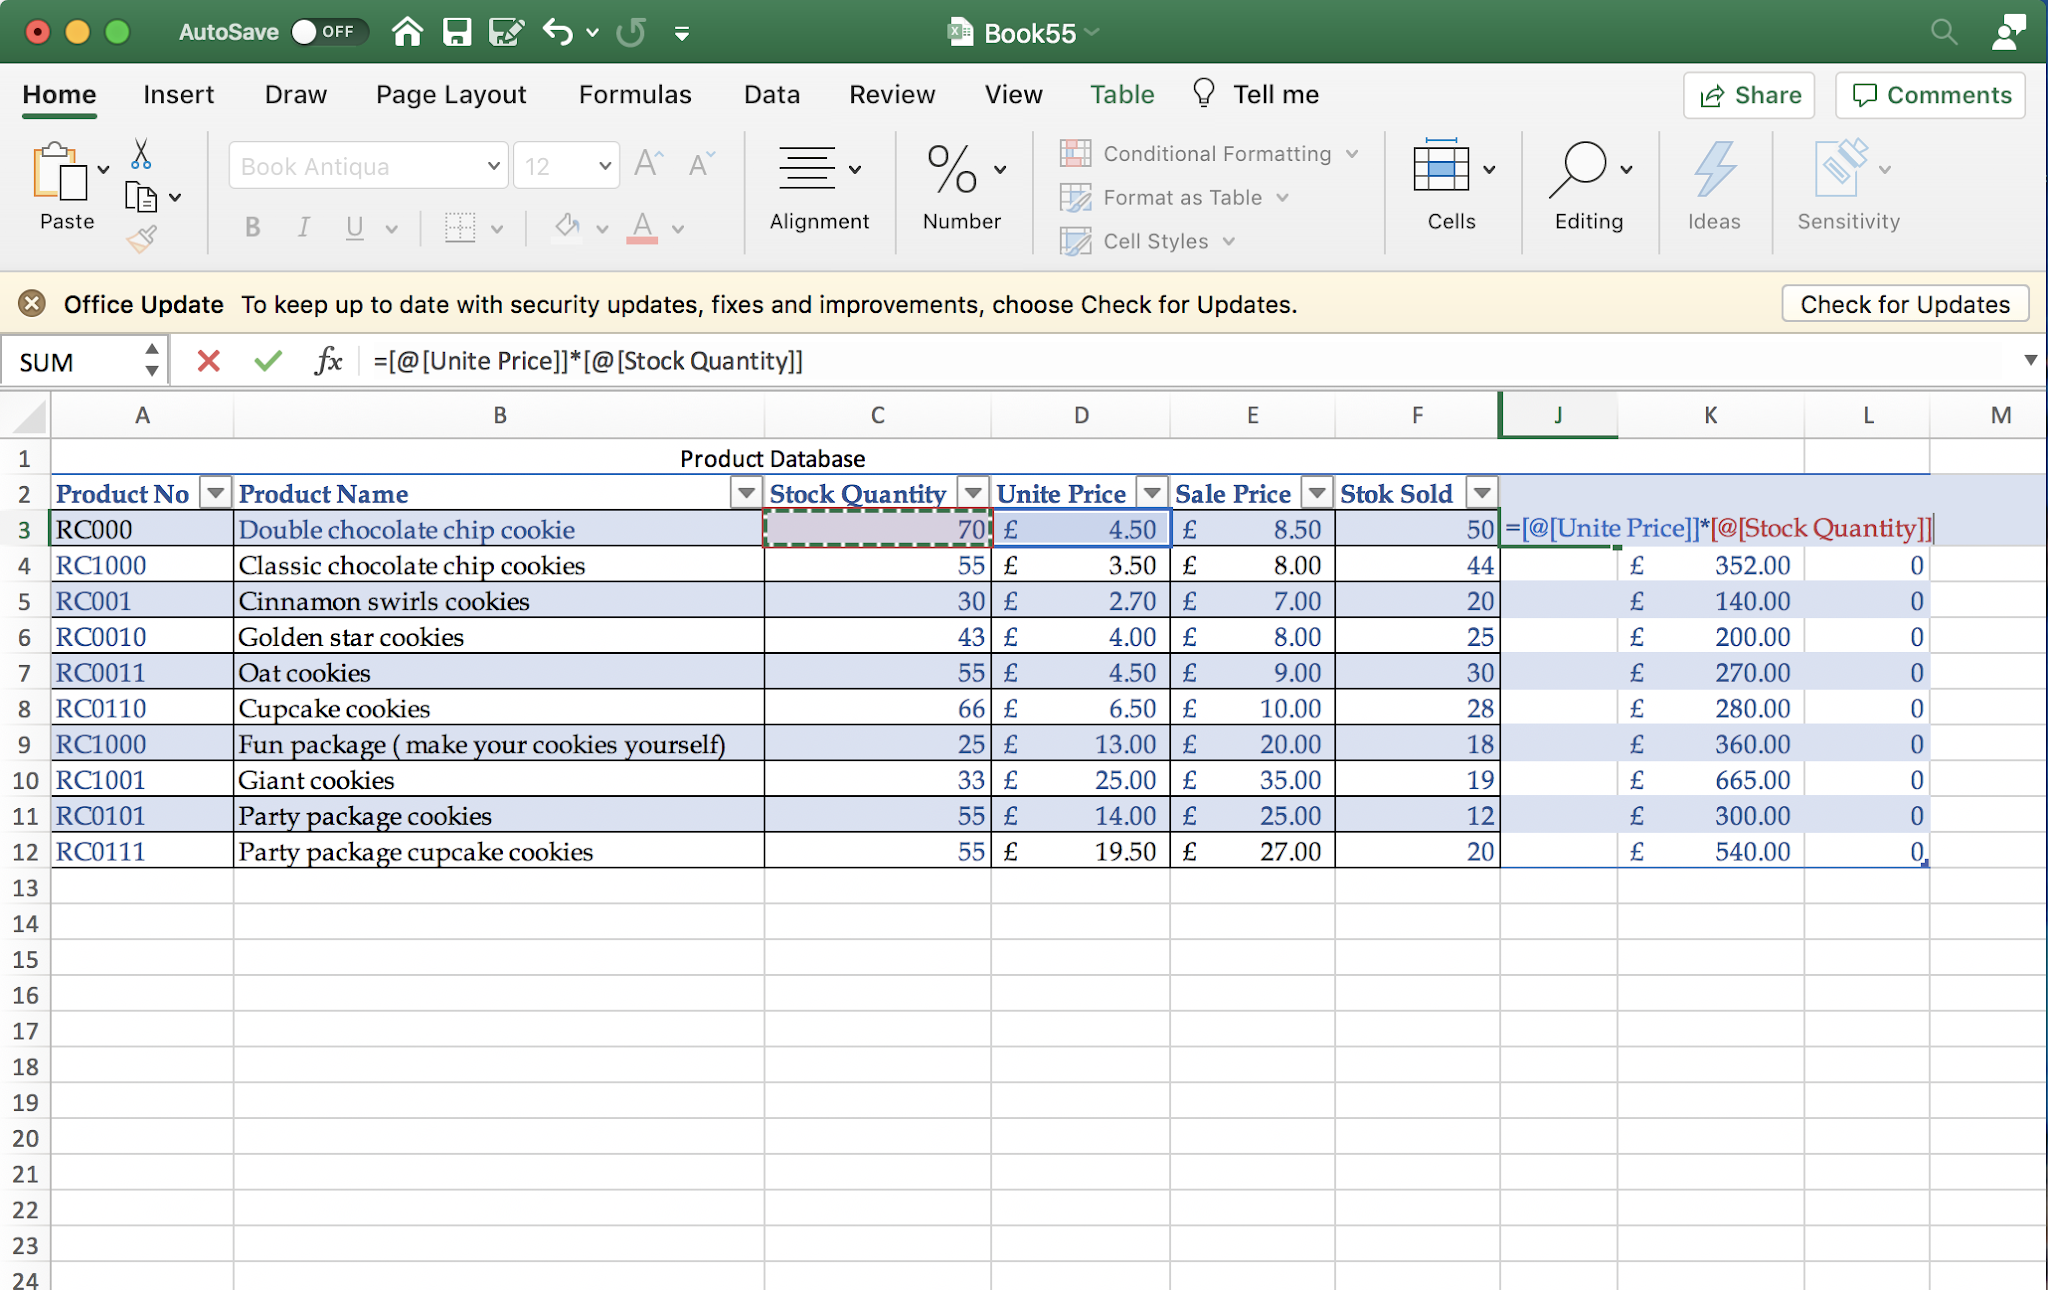 |
| Calculating the cost |
Know that we have calculated both total sales and the cost, the profit could be easily calculated. Similar to what was done, I inserted a (=) sign following that by total sales - cost. After that, clicking enter as what was done with the other field and the profit for all product will be inserted.
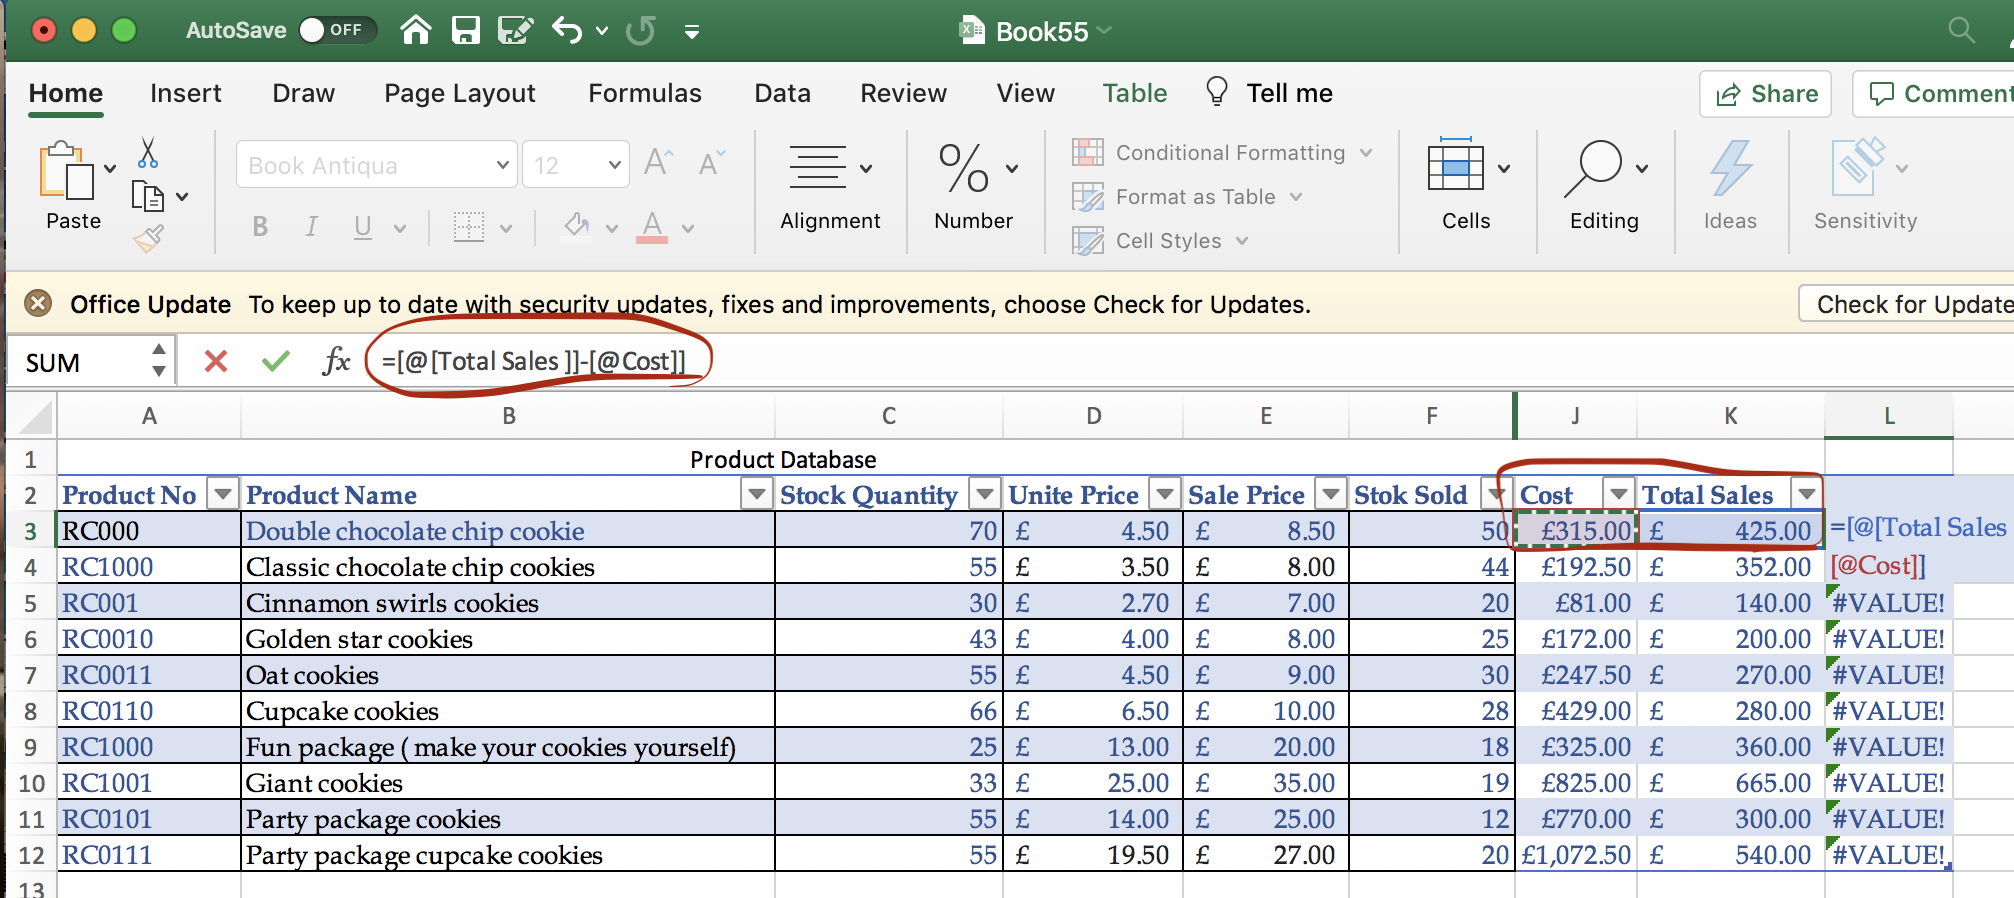 |
| Calculating the profit |
 |
| The profit values |
There is the Auto-sum formula on Excel, which I have used to find the sum of total sales, cost, and profit.
 |
| The totals |
Another function that could be used to show all the formulas that have been used on the table is the Show formulas function.
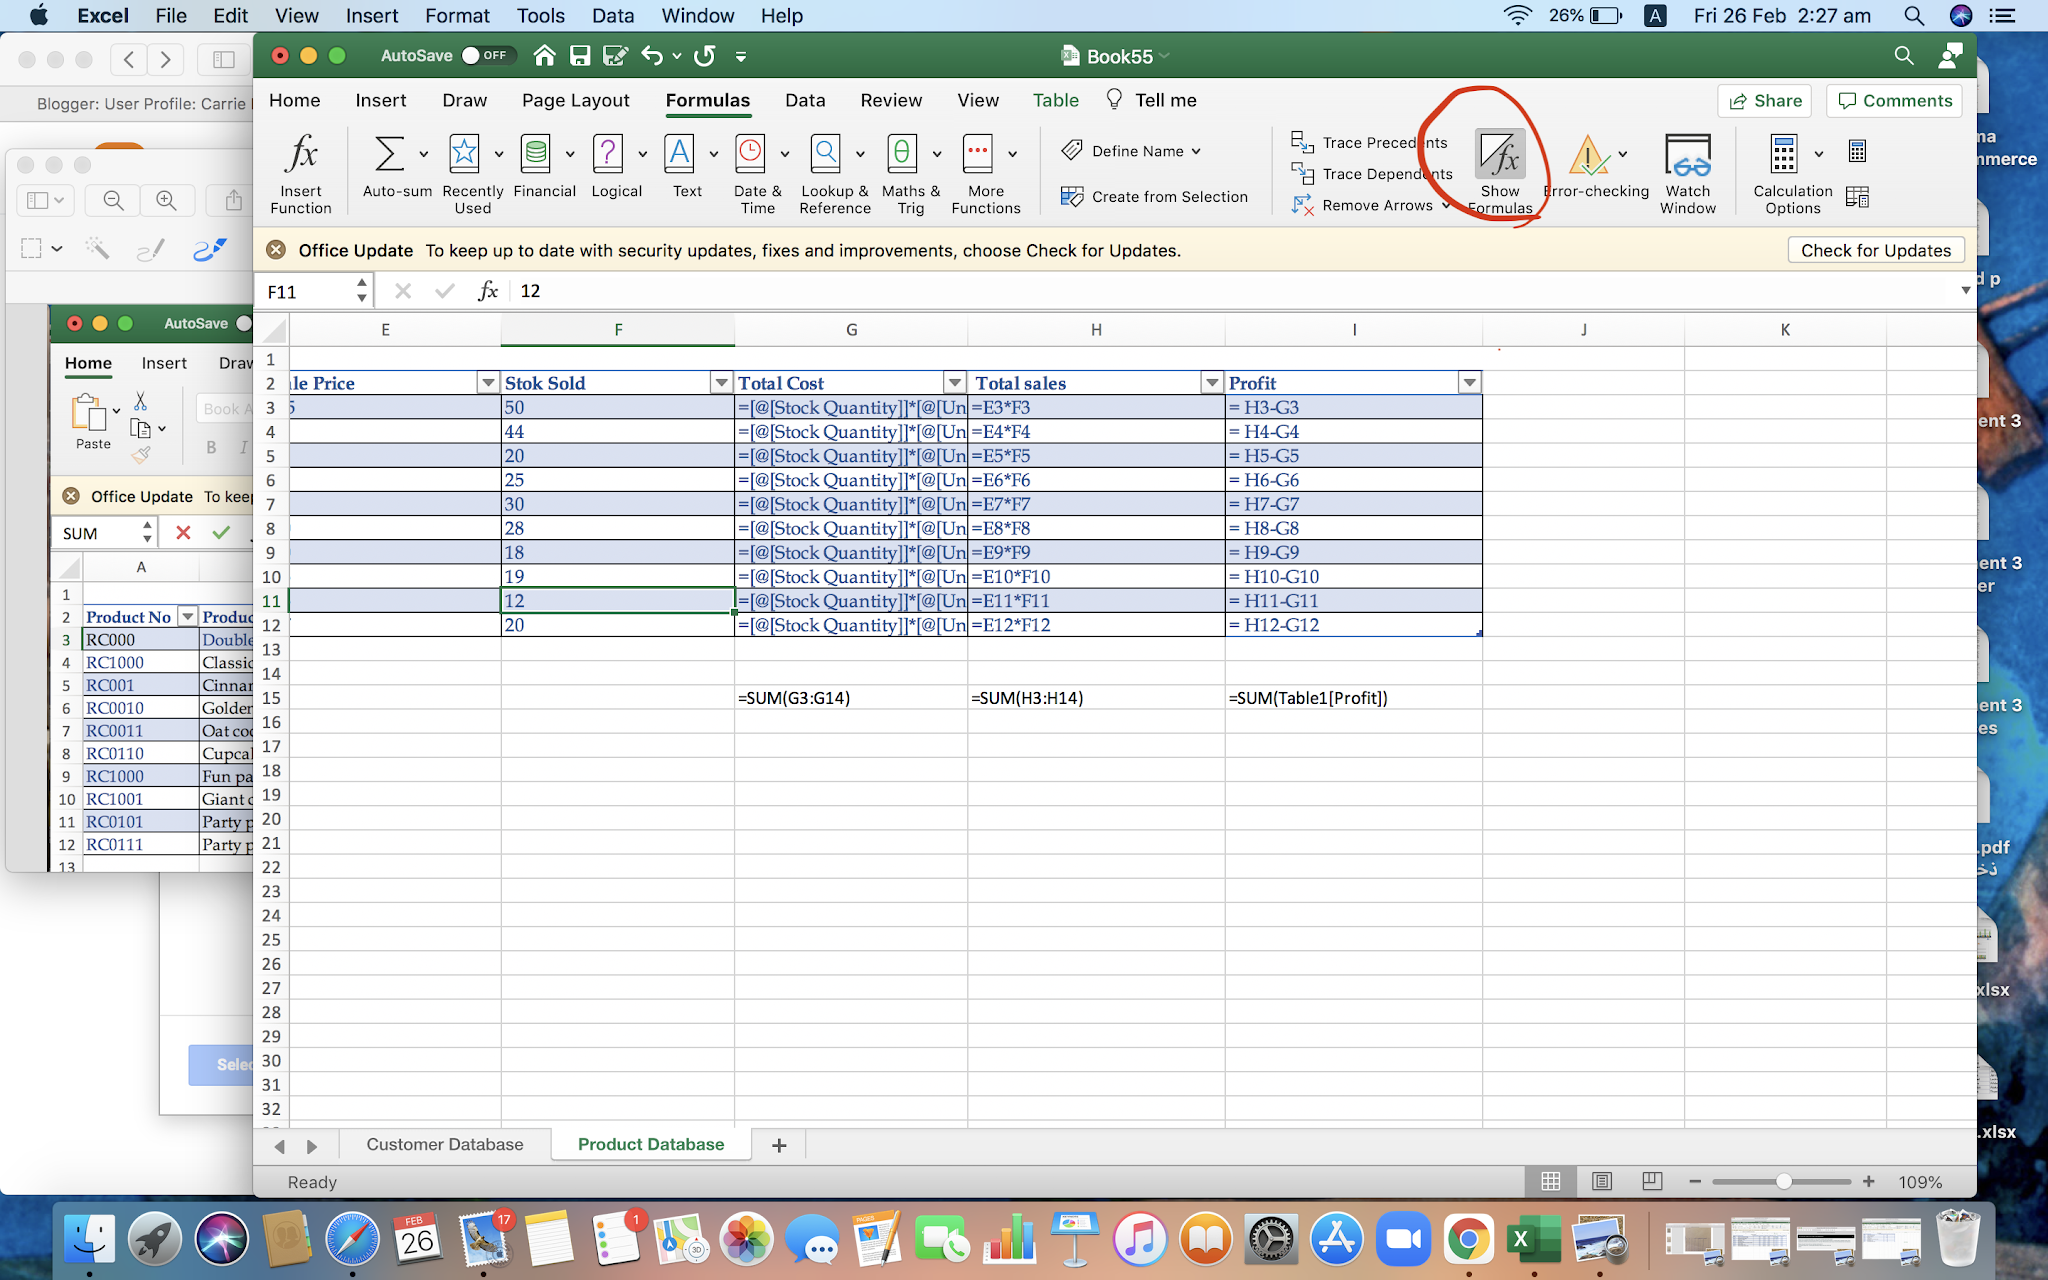 |
| Show formulas function |
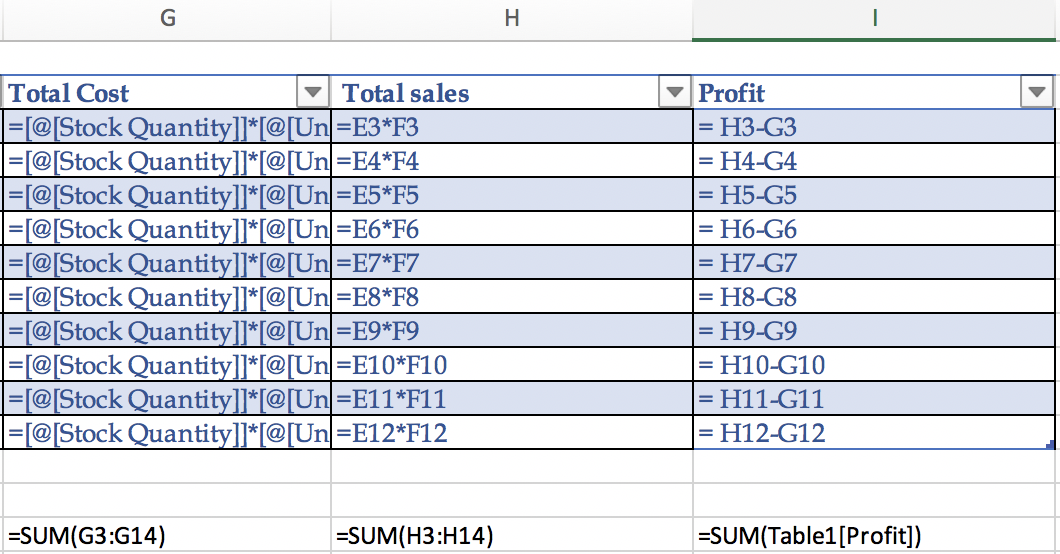 |
| The formulas used to find (total Sals, cost, profit, and totals) |
Sometimes, it is easier to view the data if it was shown visually. Thus, after completing the product database, a chart could be inserted by selecting the data wanted to be included in the chart and choosing one of the charts as shown below.
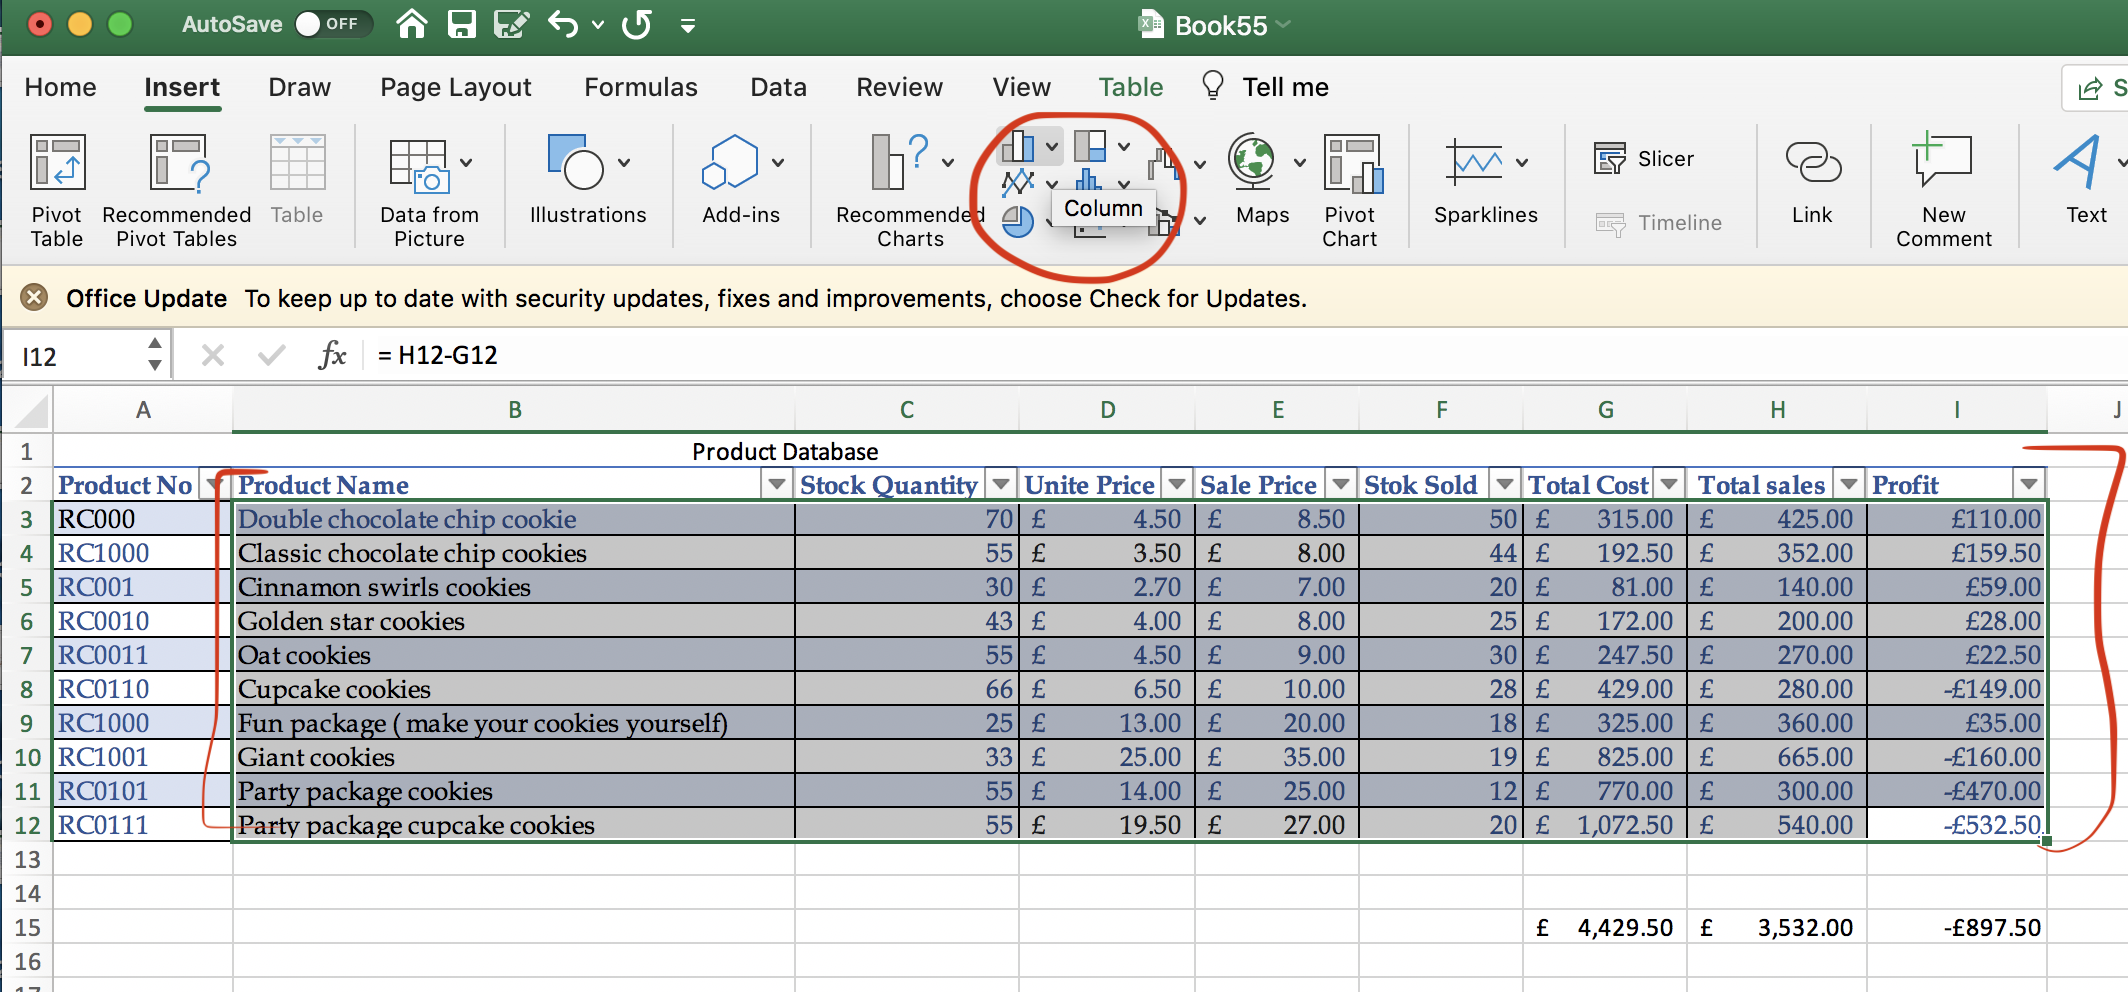 |
| Selecting a chart |
As shown below, I converted the data into a column chart. The chart shows the data in a way that makes it easier to compare and analyze the result.
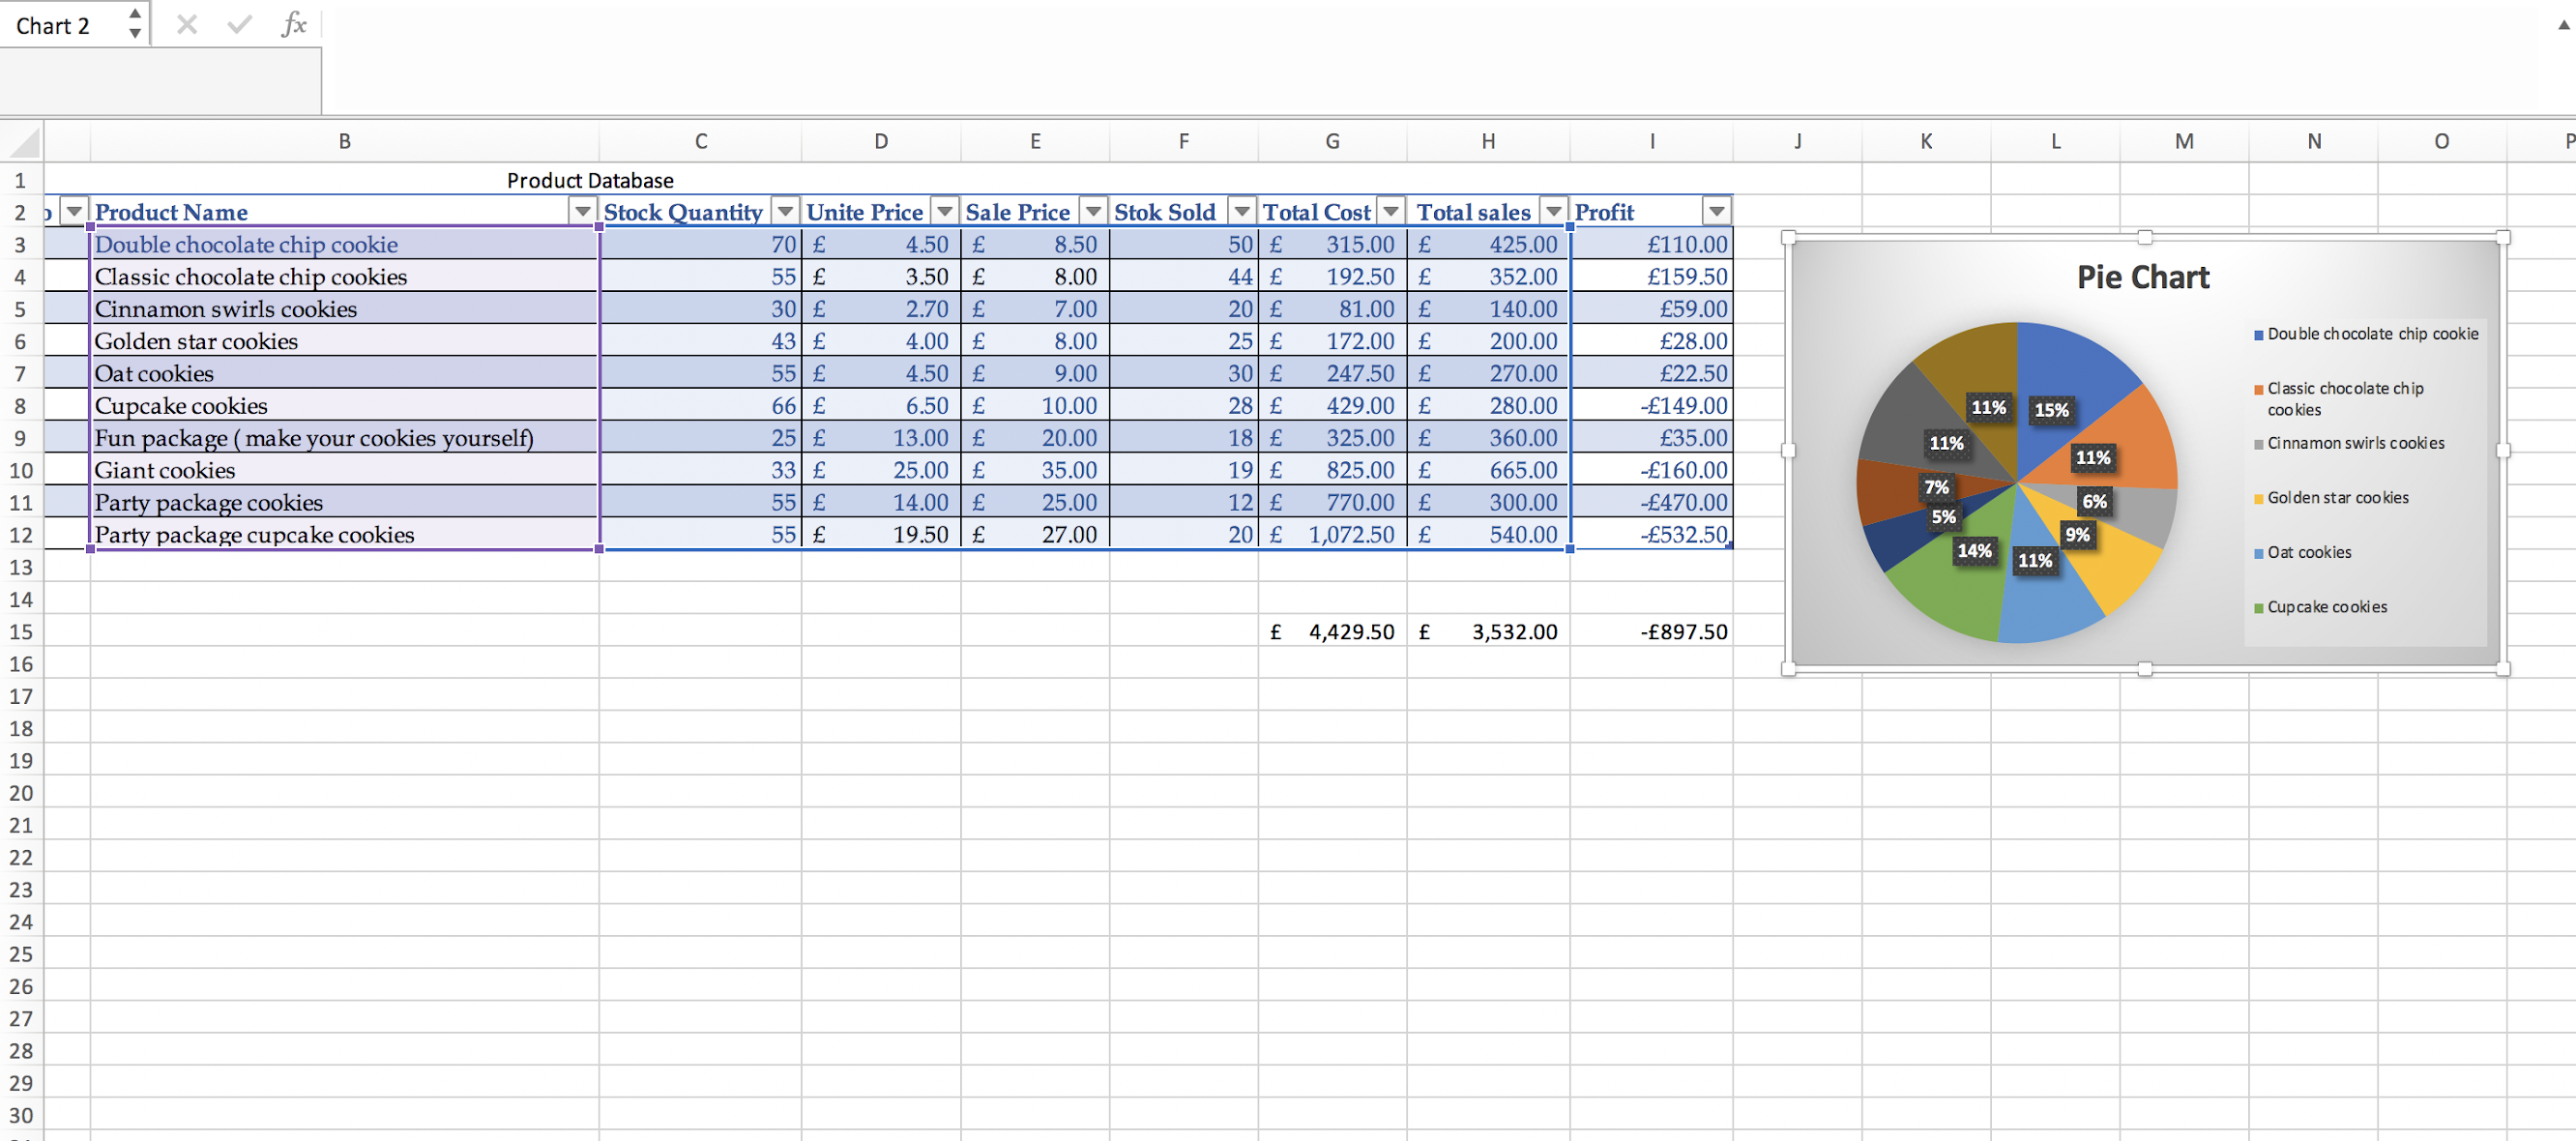 |
| Pie Chart |
However, because it is a pie chart, the profit cannot resemble. Thus, I changed it into another chart type to show the negative and positive profits.
 |
| Column chart |


Include a pie chart in there.
ReplyDelete